(Inventory > Analysis > Inventory Value > Inventory Value Summary)
Use this screen to analyze your inventory value. You can drill through to the Inventory Value by Item screen from any of the value groupings.
Screen Details
Selection Filters
The screen will launch with the Current Value displayed for all items. To change the display, select a different Date Option or Item Status and then click the Load button.
Date Options
▪Current Value
▪Value as of a Date
▪Change in value between 2 dates
Item Status
For each status selected, a row will be added to the report. The All Items selection will contain both Active and Inactive items and will tie down with the GL Inventory value.
Last Reconcile Book Value
This will display the date that you last ran your Reconcile Book Value routine. In order for your inventory values to tie down to your current General Ledger inventory value, you should first run the Reconcile Book Value routine and make sure that you do not have any unposted GL transactions.

Buttons
Load
Change any of the filter criteria in the header and select the Load button to re-populate the data grid.
Output
Output the data grid. You can further customize the columns to display in the Output tool before outputting to the printer or to Excel.
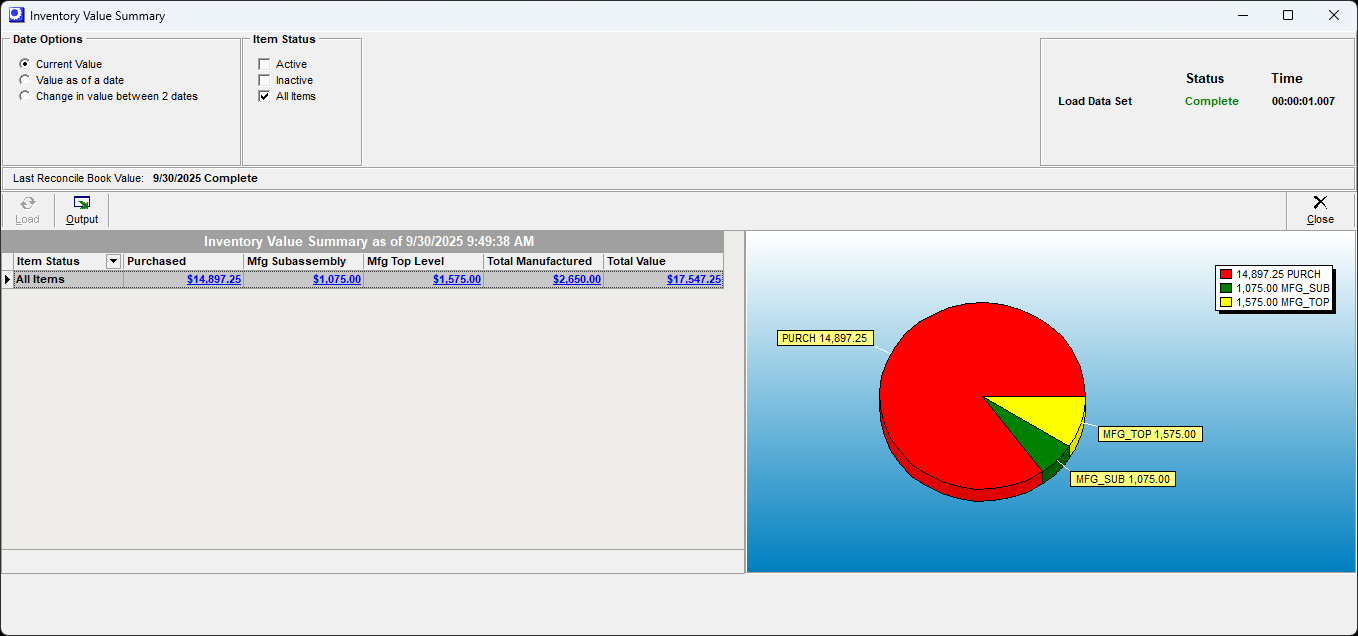
Item Types Value Groupings
Data will be be displayed in a few summary groupings that will allow you to drill thru to the Inventory Value by Item screen for details.
Purchased - This is the value for purchased items.
Mfg Subassembly - This M item is used as a subassembly in one or more active BOMs
Mfg Top Level - This M item is level zero and represents your manufactured items typically for sale
Total Manufactured - This is a total of both subassemblies and top level manufactured items
Total Value - This is the total value for all item types.
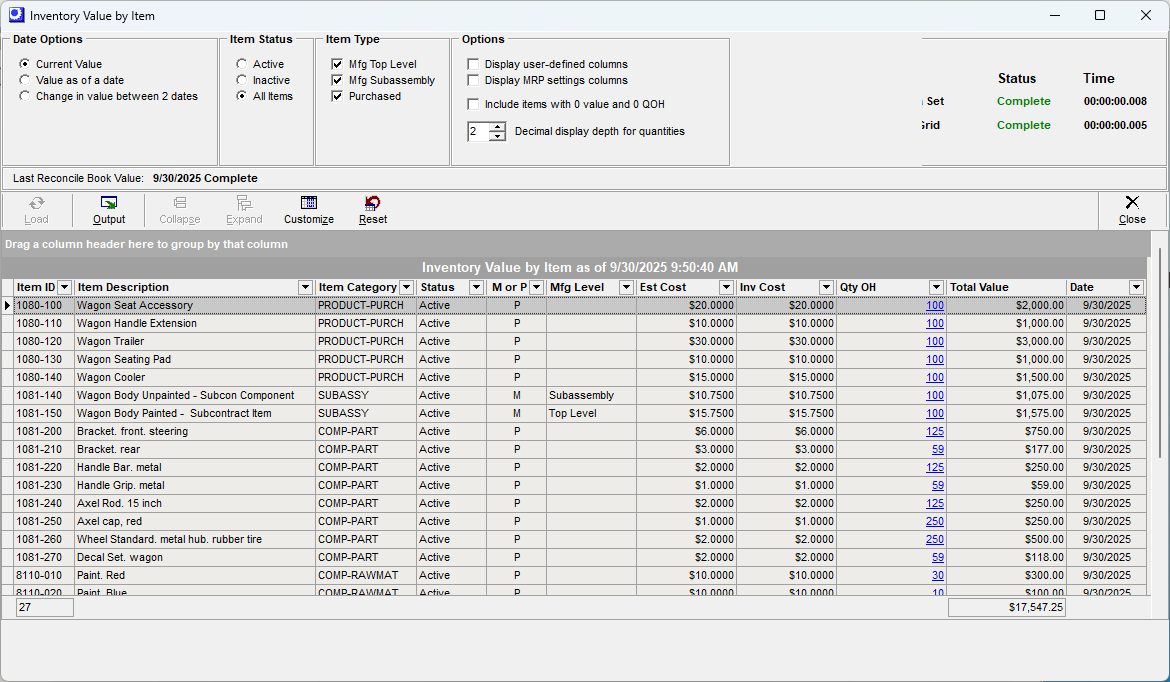
Inventory Value by Item
Drill thru from any of the cells on the opening list screen to see the Inventory Value by Item screen.
Selection Filters
The screen will launch pre-filtered to the selections of the value grouping cell from the opening list screen. You can over-write the selections and select the Load button to refresh.
Date Options
▪Current Value
▪Value as of a Date
▪Change in value between 2 dates
Item Status
For each status selected, a line will be added to the report. The All Items selection will contain both Active and Inactive items and will tie down with the GL Inventory value.
Item Type
▪Mfg Top Level
▪Mfg Subassembly
▪Purchased
Options
Display user-defined columns
This will display any user defined fields and data that you have set up against your Stock Items
Display MRP settings columns
This will display the following fields: Order Policy, Potential Demand, Min Policy, Supply Days, Min Order, and CTO.
Include items with zero value and zero QOH
This will give you the option to show items that have zero value and/or zero quantity on hand.
Decimal display depth for quantities
This allows you to set the decimal depth display for your quantities. For valuation calculation purposes, the quantity decimal and average cost multiplier will float.
Buttons
Load
Change any of the filter criteria in the header and select the Load button to re-populate the data grid.
Output
Output the data grid. You can further customize the columns to display in the Output tool before outputting to the printer or to Excel.
Collapse and Expand
In the data grid, you can group the report by dragging a column to the header area. You can then collapse and expand the groupings of data for easier analysis.
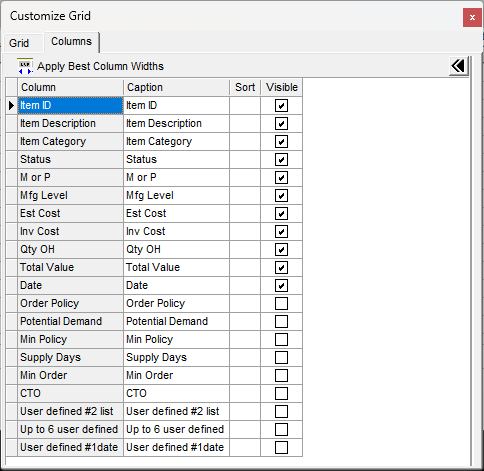
Customize and Reset
Select which columns will be visible in the initial data grid. You can restore to the default format by selecting the Reset button.
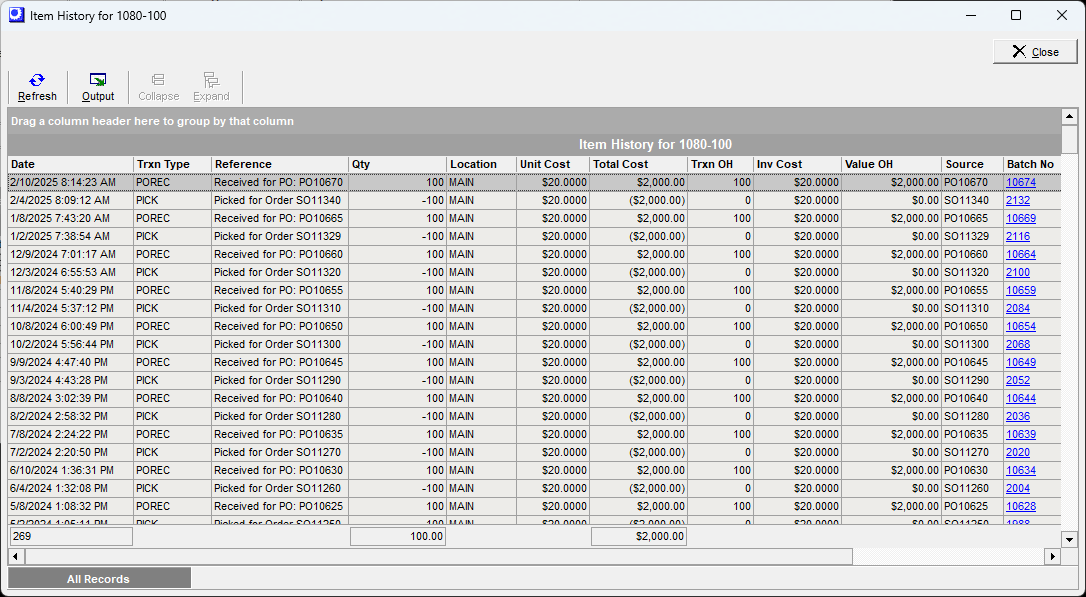
Item History Drill Thru from Qty OH field