
(GL – GL Spreadsheet Generator)
This screen is a Legacy Function
The GL Spreadsheet Generator and Budget Names functions have been replaced by the new GL>Analysis>Profit & Loss Accounts and GL>Analysis>Balance Accounts screens.
Screen Help - GL Analysis Profit and Loss Accounts
Screen Help - GL Analysis Balance Accounts
Legacy Screen Help
Spreadsheets such as Excel are ideal for analyzing financial data. If you wish to compare financial periods from one year to the next, or compare budget projections with actual performance, the spreadsheet accommodates an unlimited number of columns, whereas a standard report can only display three or four columns at most.
Once your data is in Excel, you can organize subtotals, calculate percentages, apply formulas, create graphs, link spreadsheets, and create almost any type of printed output.
The GL Spreadsheet Generator is a utility that enables you to extract general ledger data out of DBA and into Excel in a variety of user-defined formats that you can re-use over and over again.
Essentially, the GL Spreadsheet Generator gathers the data for you and then Excel is used to manipulate and present the data. Using DBA with Excel is a combination that provides you with almost unlimited financial analysis.
Training Video
Support Center – Videos–How Do I? – General Ledger Training Course
Segment: GL Spreadsheet Generator
What types of data sets can be created?
The following are the types of data sets that could be generated using the GL Spreadsheet Generator:
| • | Comparative balance sheet by period |
| • | Changes in financial position |
| • | Best or worse case budget scenario |
| • | Budget vs. actual year-to-date |
| • | Year-to-date income statement |
| • | Comparative income for last three years |
| • | Income by period – trailing 12 months |
| • | Absorbed vs. actual overhead |
| • | Projected vs. actual sales |
| • | Gross profit by period |
| • | Absorbed vs. actual costs |
Creating a new spreadsheet
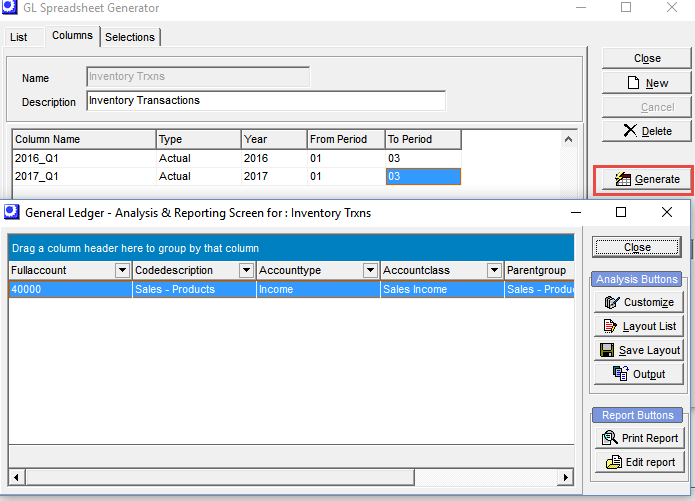
To create a new spreadsheet, click the New button. You are taken to the Columns screen where you can enter the Name and Description that will be used to identify this spreadsheet on the opening List screen.
Columns Tab
In the Columns tab screen you define the columns that are to be included in your data set and spreadsheet. Enter and define as many spreadsheet columns as you wish. Within your columns you can mix and match any combination of budget, actual performance, years, and date ranges.
Upper Panel
Name
Enter an up to 20-character Name to identify your spreadsheet on the List tab.
Description
You can enter an up 50-character Description to accompany the Name on the List tab.
Grid Columns
Column Name
You must give each column a Column Name.
NOTE: This must be a single word with no spaces.
Type
This refers to the type of data to be displayed in the column. You can select ‘Actual’ or any of your budgets.
Year
Select ‘C’ for the current year, ‘P’ for the previous year, ‘N’ for next year, or you can specify a particular fiscal year.
From Period - To Period
Within this year, you can specify a from and to period. For example, if you want the first column to be the month of January, you would select period ‘01’ through period ‘01’. If you want the first column to be the first quarter of the year, you would select period ‘01’ through ‘03’. Or, if you want your first column to be the entire year, you would select period ‘01’ through ‘12’.
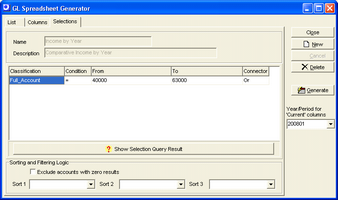
Selections Tab
The Selections tab is where you select ranges of GL accounts that will populate the columns you created in the Columns tab screen.
Upper Panel
Name, Description
These are read-only fields that identify your spreadsheet.
Grid Columns
Classification
Your range of accounts can be determined buy any of the following:
| • | Account Type |
| • | Account Class |
| • | Account Group |
Condition
Select one of these options:
| • | = |
| • | <> |
Select the equal sign when you want to include a range in your selection. Select ‘<>’ if you want your range to be excluded from selection. You could, for example, enter a wide range of items, such as all your expense accounts, in one line using the equal sign, and then in a second line you could exclude a small range of expenses within that first range, using the ‘<>’ condition.
From – To
The lookups in these fields are determined by your selection in the Classification field.
Connector
This field cannot be blank. Your choices are:
| • | And |
| • | Or |
| • | GroupOr |
How to use the Connector
When all you are entering is one line, this field has no meaning and can be left as is. Also, if this is the last line, this field has no meaning, and can be left as is.
Now let’s say you want a group of accounts from one section of your chart of accounts, and for some reason you want another group located somewhere else. You might be comparing absorbed WIP overhead versus actual overhead, for example. Select your first range on one line, and in the Connector field, select ‘Or’ and then enter your second range in line 2.
Whenever you want to include separate groups of accounts like this, always use the ‘Or’ connector. You are telling the program to select this range, or this range, or this range. So think of ‘Or’ as meaning “Or also.”
The ‘And’ connector is used to filter or limit a range to just some accounts within the range. Typically, this is used with multi-segment GL account code structures where a second or third segment might represent a sub-account or department.
You could say I want all my office expenses ‘And’ I want only segments ranging from this value to this value. So think of ‘And’ as meaning “and within.”
And let’s say you want to define another group of ranges that also contains an ‘And’ connector. End your last group line with a ‘GroupOr’ connector, which tells the program that you are defining a separate group on the next line. So ‘GroupOr’, in effect, acts like a bracket in a mathematical expression and separates one group of lines from another group of lines. So think of ‘GroupOr’ as meaning “Or also another Group.”
The ‘And’ and ‘GroupOr’ connectors are typically used to isolate data to specific departments or sub-accounts. If you have single-segment GL codes, you will almost exclusively use ranges of accounts.
Show Selection Query Result Button
In the background, the selection columns generate an SQL query on the GL transactions table. If you want to see the actual query that gets generated, click this button.
Lower Panel
Use these settings to determine the sort order of your spreadsheet rows. If you wish to sort the rows in GL account code order, for example, you would select ‘FullAccount’ in the Sort 1 field and leave the Sort 2 and Sort 3 fields blank.
Generating your spreadsheet
Now that your spreadsheet has been set up, it can be generated whenever you wish. To do so, go to the List tab and highlight the spreadsheet you wish to run.
List Tab
Year/Period for ‘Current’ columns
Select the accounting period that you consider to be the “Current” period. Any Year or From Period or To Period columns with a ‘C’ setting will gather its data from this period or year. Any columns with a ‘P’ setting (Previous) will gather its data from the prior year and any columns with an ‘N’ setting (Next) will gather its data from the next year (in the case of budget amounts).
Generate Button
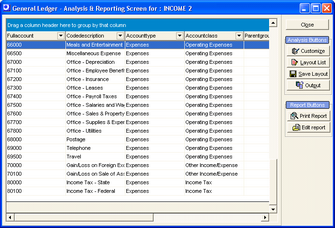
Click this button to generate your spreadsheet. The data set you have selected is displayed in the Analysis screen, which is a spreadsheet type grid that displays all the available fields, along with all the records that comprise them. At this point, all the available fields within each GL account are displayed.
Normally, you would not want to view all these columns. So the next step is to create your own queries, which are limited to the fields you want to include.
Customize Button
The query is reduced to just the fields you want by dragging unwanted fields off the screen. This is done via the Customize button, which presents a box in the lower right corner of the screen. To remove a field, drag its column heading and drop it into the box. Continue removing fields one by one until you are left with the fields you want.
Save Layout Button
When done, click the Save Layout button, and give your query a name. This adds your query to the Layout List. Now whenever you want to run this query again, you select it from the Layout List, click the Restore button, and your custom layout is displayed once again.
Column filtering & grouping
Before you generate your final spreadsheet, you can perform additional filtering and grouping on your data set.
Column Filtering
You can click the down arrow on any column heading and from the drop-down list, select a particular value.
If the column is a date field, you can click the column heading down arrow, select the ‘Customize’ option, and then enter ranges of dates.
Column Sorting
You can sort your list by clicking on any of the column headings, which will then sort the entire list by that column. Click the heading a second time and the sort order will change from ascending to descending, or vice-versa.
Output Options
At this point, the Analysis screen is functioning as an inquiry screen. You can go a step further, however, and click the Output button to output this information into the following formats.
| • | Output to the printer |
| • | Output to HTML |
| • | Output to Text |
| • | Output to Excel |
Output to the Printer
When you select this option, a print preview screen is displayed. You can click File – Page Setup to select various options that will change the report appearance. When the format is to your satisfaction, click the Print button.
Output to HTML, Text, Excel
When you select these options, you are prompted to save the file to a name and location.
