(Inventory > Analysis > Inventory Transactions)
Use this screen to analyze your inventory transactions by quantity or total value (qty x unit cost) over time. In the settings screen, you can define custom date range columns or a series of date range columns to view trends over time. There are special columns for totals, averages, peak values, and comparisons of two columns. In the reporting grid, all of the column headers contain filtering capabilities and you can drag and drop for custom groupings of data. You can also drill through from the quantity or value cells to view the Item History transaction details.
Related Help:
 MRP Settings - Order Policy Screen
Data Import - Demand Driven Items Update
Data Import - Convert Manual Reorder Point to Demand Driven
Related Video:
 Analysis Monthly Trend for Stock Items
Analysis Screen Basics
1.Report on Quantities or Total Value for your user defined data columns
2.Create a series of columns with Total, Average, and Peak Value columns. The Monthly Trend Series option provides a multi-item version of the Monthly Trend data found in the MRP Settings > Item Order Policy screen
3.Filter your data to a reasonable number of items by using MRP Analysis Codes, Item Type, Item Categories or a single Item selection.
4.Use the Load button to populate data in your report grid
5.Drill through from any data cell in your report to view Item History transaction details for the column date range
6.Data in grid can be manipulated, sorted and grouped to your preference.
7.Output to Excel for additional analysis
Screen Details
Selection Filters
Use the selection filters in the upper panel, define your date columns in the Settings button, and select the Load button to generate a list of transactions in the reporting grid.
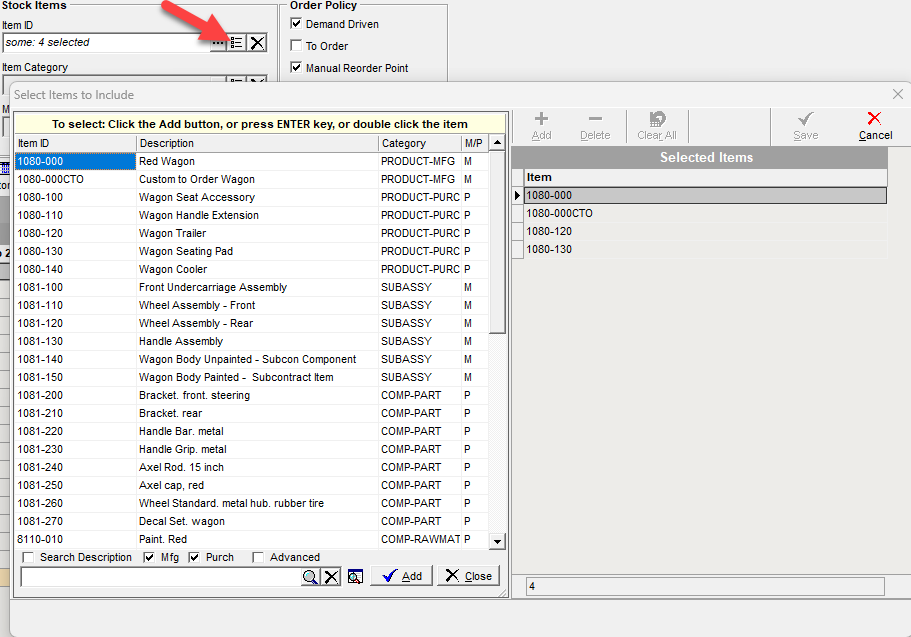
"Some" Filter Tool
Select multiple IDs and save in the filter criteria. This allows you to define a set of IDs when you "Load" the data grid.
Transaction Type
Select the Transaction Type groupings that you would like to report on.
▪Total Usage (ISSUE + PICK)
▪Receipts (POREC + JOBREC)
▪Total Adjustments (STKADJ + COUNT)
▪Net Change (All Trxn Types)
▪Job Issues (ISSUE
▪Order PIck (PICK)
▪Stock Count (COUNT)
▪Stock Adjustment (STKADJ)
▪Beginning Balance
Special Filters
oInclude items with no activity
oInclude inactive items
Item Type
Select All, Purchased or Manufactured Item Type. Manufactured has an option for top level or subassembly items.
Item ID
Select all, one or some item IDs.
Item Category
Select all, one or some Item Categories.
MRP Analysis Code
You can isolate your analysis to an MRP Analysis Code which allows you to create a custom grouping of items. This is an effective way to limit the number of items that will display when you load your data.
Screen Help - MRP Analysis Codes
Order Policy
Select Demand Driven, Manual Reorder Point, and/or To Order. The Demand Driven and Manual Reorder Point can be used in conjunction with the Add Monthly Trend Series to create a multi-item report that reproduces the single item Monthly Trend found in the Order Policy screen.
Buttons
Load
After you have defined your reporting columns in the Settings screen, click this button to populate the reporting grid.
Settings
The settings button is where you define and edit the dynamic columns for your analysis (see details below).
Output
Click this button to output the grid contents using a variety of filtering and sorting options. You can print this report or output to Excel
Link:
Collapse, Expand
The grid supports a drag and drop grouping of data.
Customize
You can customize the fields that display in the grid.

Settings Screen (Settings Button)
This Settings button will be used to add and edit the columns for your analysis. You must first define your columns and then use the Load button to populate the report grid.
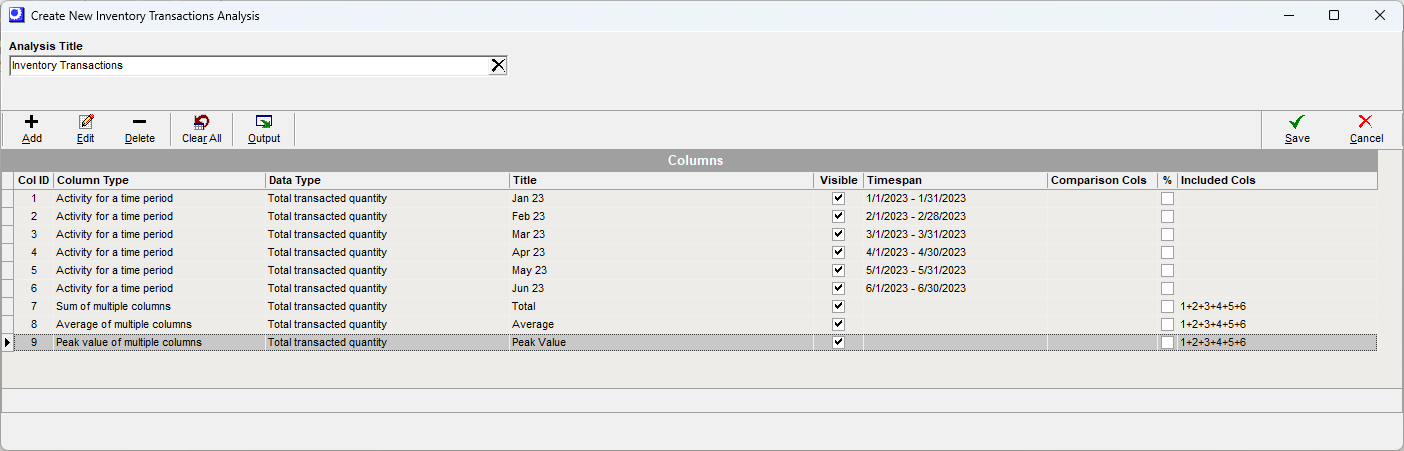
Analysis Title
This is the name of the report and output to Excel.
Settings Screen Buttons
Add Button
The Add button is used to define the columns for analysis. (See details below)
Edit Button
Select any column in the grid to edit.
Delete Button
Select any column in the grid for deletion. If the column is used in a calculation you may be prevented from deletion. You can use the clear all and start over.
Clear All
This will clear all columns in the Settings grid for a quick start over.
Add Button Functions
You must add a time period column(s) or a time period series of columns prior to loading data for analysis. The Time Period series and Monthly Trend series have built in options for Totals, Average, and Peak value.
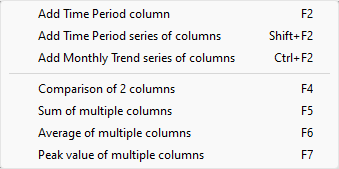
Add Time Period column
This will allow you define a period of time for your report analysis. As an example, you may want to create a period for the most recent month and then make a second column for year to date values.
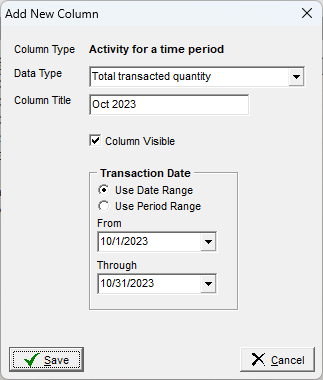
Column Type
This will describe the criteria for the data summary for the defined report column.
Data Type
Define the data type for your column:
•Total transaction quantity
•Total transacted value (qty * cost)
Column Title
This will be the heading of the column of your report. You can edit this at any time and then Load the report to update in the report analysis grid.
Column Visible
If this is checked, the column will be visible in the report grid.
Transaction Date
Select either a date range or accounting period range.
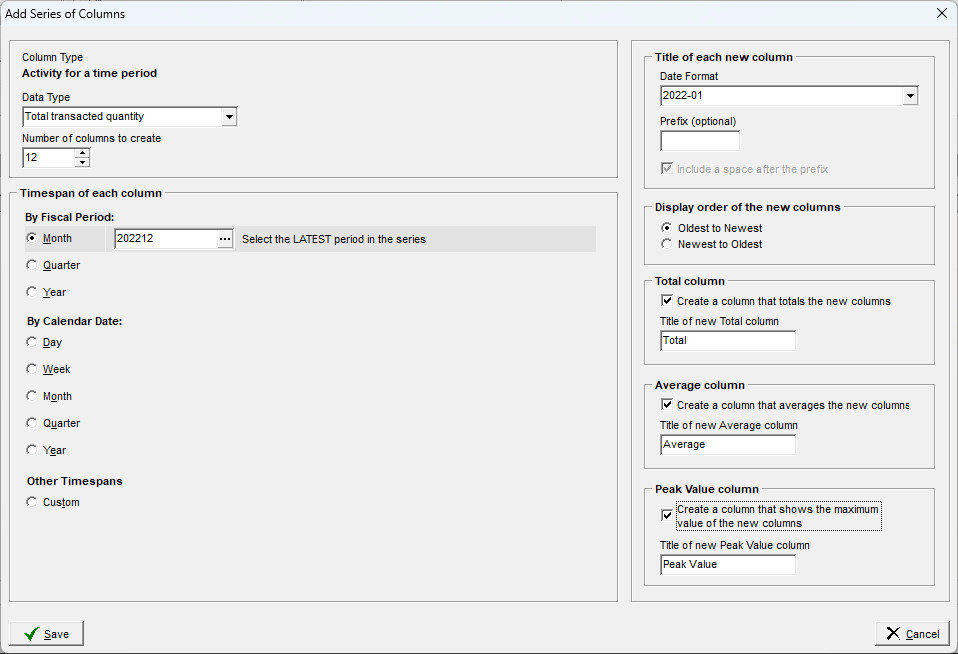
Add Time Period series of columns
This will allow you define a sequential series of columns for your report analysis. As an example, at year end you can perform a monthly report for the trailing 12 months. You will enter the last date of the series and then define the number of columns trailing to create.
Column Type
This will describe the criteria for the data summary for the defined report column.
Data Type
Define the data type for your series of columns:
•Total transaction quantity
•Total transacted value (qty * cost)
Number of columns to create
This will set the number of sequential date columns to create. You will select the grouping and last date in a timespan and it will create the trailing time period columns.
Timespan of each column
You define the timespan of each column and select the final date in the range.
By Fiscal Period
Report column groupings by period, quarter or year. Choose the last accounting period in the range. Verify the number of columns to create.
By Calendar Date
Report column groupings by day, week, month, quarter or year. Choose the last date in the range. Verify the number of columns to create.
Other Timespans
Define a custom range of time. Choose the last date in the range. Verify the number of columns to create
Report Examples:
For a quarterly report for 2022, you choose the Quarter radio button, choose the last period of Q4 for 2022 or the last date of Q4 of 2022, and set the number of columns to create = 4.
For a monthly report for 2022, choose the Month radio button, choose the final period or last day of 2022, and set the number of columns to create = 12.
Title of each new column
Choose the format of the columns created. Optionally you can add a prefix to your columns.
Display order of the new columns
This allows you to designate your preference of date order of your report columns from left to right.
Total Column
If selected, a column will be created that will be the total of all columns created with this tool. You can customize the column header title.
Average Column
If selected, a column will be created that will be the average of all columns created with this tool. You can customize the column header title.
Peak Column
If selected, a column will be created that will show the maximum value of the data columns created with this tool. You can customize the column header title.
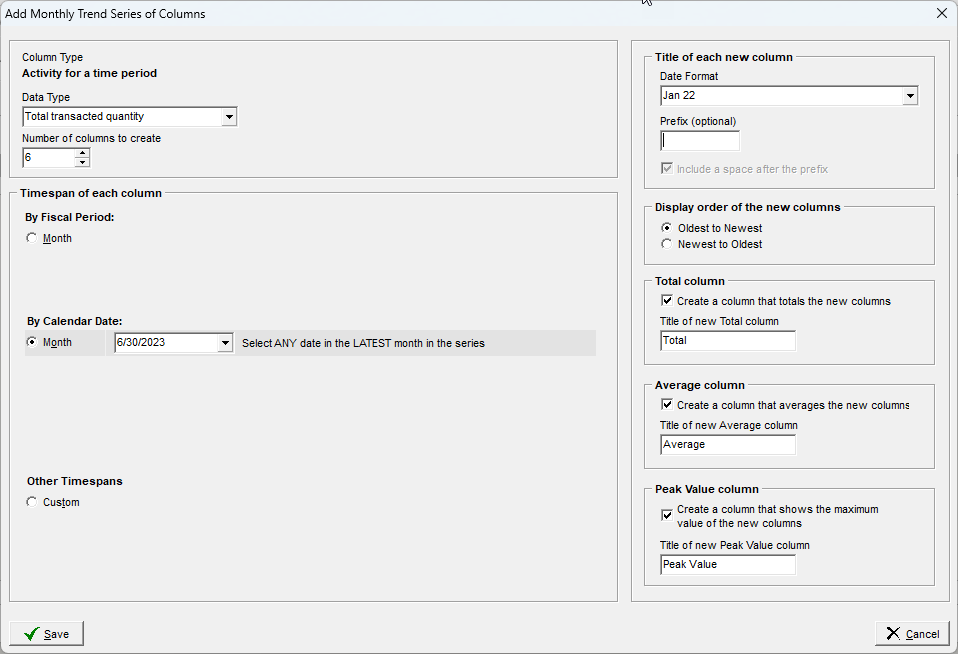
Add Monthly Trend Series of Columns
This is a special format intended to review your items that you stock (Demand Driven and Manual RP). This will allow you define a sequential series of monthly columns for your report analysis. You will enter the last date of the series and then define the number of trailing columns to create. For trend usage analysis, we recommend you choose at least a 6 monthly columns.
Reviewing your Order Policy Settings Across Multiple Items
When you load your data for this report, columns for your MRP Monthly Demand, Min Order Policy, Supply Days, and Min Order will be added to the report grid. This will allow you to compare your monthly trends to your MRP settings. There will be a live link to the individual Order Policy screen from the Order Policy column in the report.
Column Type
This will describe the criteria for the data summary for the defined report column.
Data Type
Define the data type for your series of columns:
•Total transaction quantity
•Total transacted value (qty * cost)
Number of columns to create
This will set the number of sequential date columns to create. You will select the grouping and last date in a timespan and it will create the trailing time period columns. For Monthly Trend analysis we recommend at least 6 months.
Timespan of each column
You define the timespan of each column and select the final date in the range.
By Fiscal Period
Choose the last accounting period in the range. Verify the number of columns to create.
By Calendar Date
Choose the last date in the range. Verify the number of columns to create.
Other Timespans
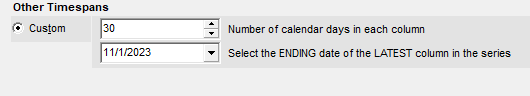
This is a special filter that reproduces the Order Policy screen Monthly Trend and Graph Data. The can create 30 day buckets starting from today's date working backward by the number of columns defined.
Screen Help - Order Policy Screen
Title of each new column
Choose the format of the columns created. Optionally you can add a prefix to your columns.
Display order of the new columns
This allows you to designate your preference of date order of your report columns from left to right.
Total Column
If selected, a column will be created that will be the total of all columns created with this tool. You can customize the column header title.
Average Column
If selected, a column will be created that will be the average of all columns created with this tool. You can customize the column header title.
Peak Column
If selected, a column will be created that will show the maximum value of the data columns created with this tool. You can customize the column header title.
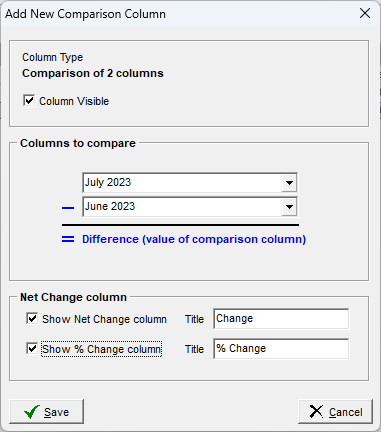
Comparison of 2 columns (Net Change and % Change)
After you have added two or more columns to the Settings grid you can compare any two columns of data. You can calculate and display a total net change and/or a percentage change.
Column Type
This will describe the criteria for the data summary for the defined report column.
Column Visible
If this is checked, the column will be visible in the report grid.
Columns to compare
Select the two columns for comparison. Note that the second column selected is subtracted from the first column.
Net Change column
You can select to show Net Change and/or % Change columns. You can customize the column title for each.
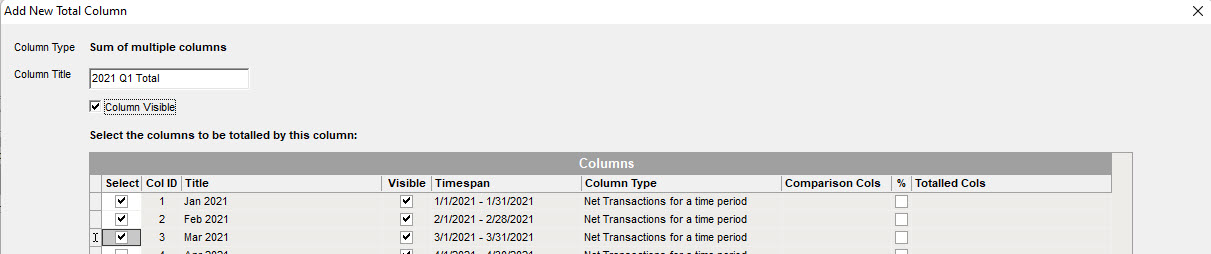
Sum of multiple columns
After you have defined multiple columns you can sum any two or more. Note: The series of columns has a built in total option.
Column Type
This will describe the criteria for the data summary for the defined report column.
Column Title
This will be the heading of the column of your report. You can edit this at any time and then Load the report to update in the report grid.
Column Visible
If this is checked, the column will be visible in the report grid.
Select Checkbox
Select all columns you wish to be included in the total calculation.
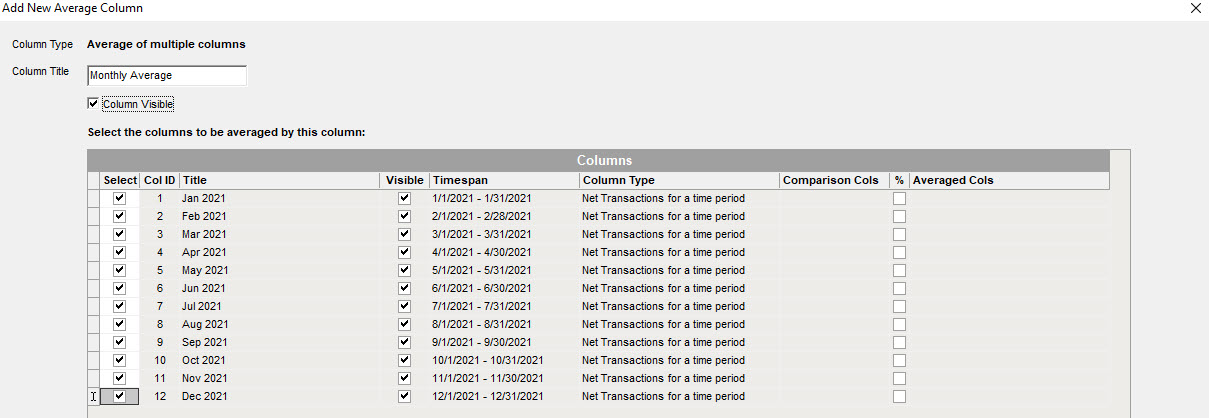
Average of multiple columns
After you have defined multiple columns you can average any two or more columns. Note: The series of columns has a built in average option.
Column Type
This will describe the criteria for the data summary for the defined report column.
Column Title
This will be the heading of the column of your report. You can edit this at any time and then Load the report to update in the report grid.
Column Visible
If this is checked, the column will be visible in the report grid.
Select Checkbox
Select all columns you wish to be included in the average calculation.
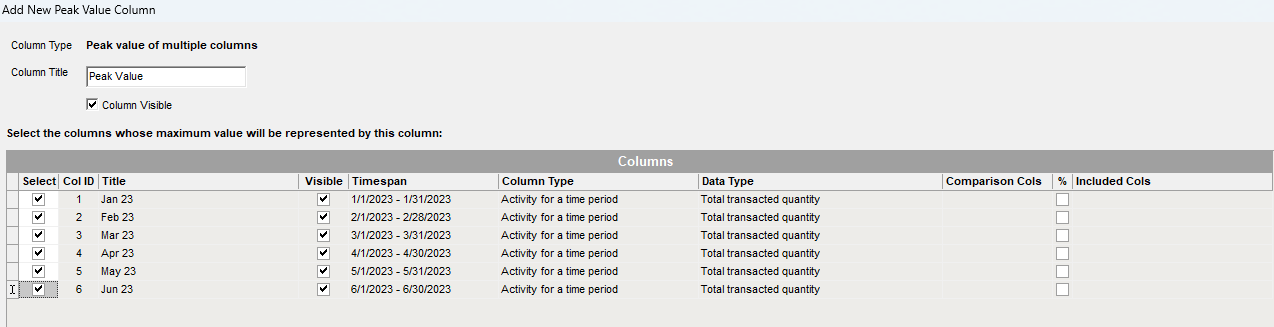
Peak value of multiple columns
After you have defined multiple columns you can display the peak value of any two or more columns. Note: The series of columns has a built in Peak value column option.
Column Type
This will describe the criteria for the data summary for the defined report column.
Column Title
This will be the heading of the column of your report. You can edit this at any time and then Load the report to update in the report grid.
Column Visible
If this is checked, the column will be visible in the report grid.
Select Checkbox
Select all columns you wish to be included. The largest value in any of the selected columns will be displayed as the Peak value.
Analysis Grid Fields
Once you have defined your data columns and selected your filtering options, you will select the Load button to populate your custom Data Grid.
Special Features
Item ID
You can actively link to the Stock Item screen from the Item ID field if you have menu permissions.
Order Policy
You can drill through to the Order Policy screen for an individual item by selecting the Order Policy name in light blue, if you have menu permissions to MRP Settings.
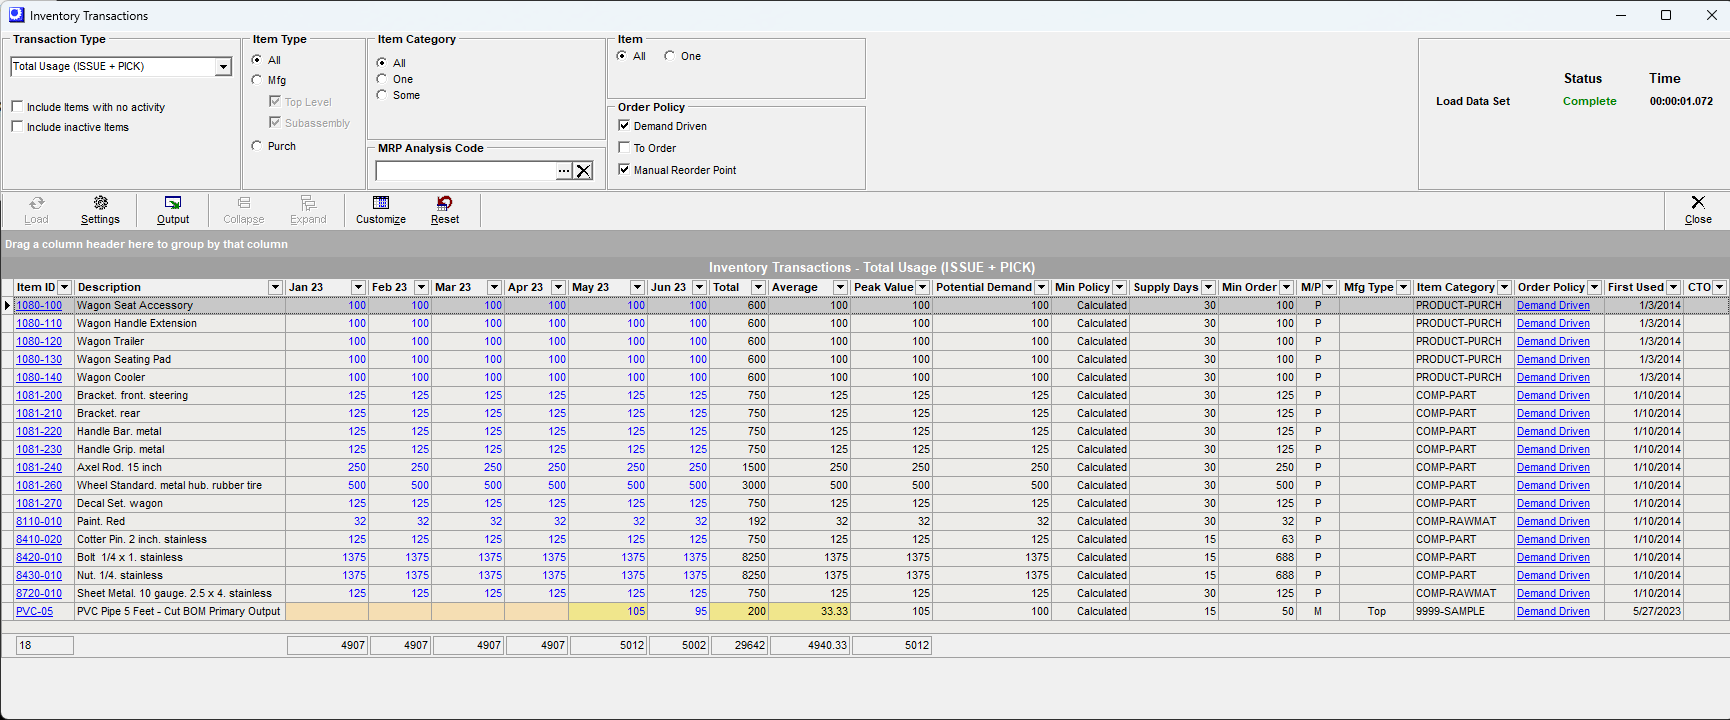
First Used Date - Shading for Incomplete Data Sets
The report has a First Used date for every item. This date is based on the first Order PIck (PICK) or Job Issue (ISSUE) transaction. Based on the First Used date, the report will provide shading for incomplete data sets. In the screenshot above, the Item ID PVC-05 had a First Used date of 5/27/2023. The first 4 columns had no data, the May 23 column was yellow because it was a partial data set, June 23 was not shaded and was complete. The Total and Average fields are yellow because they are not complete calculations. The Peak value will not be shaded for incomplete data sets and will show the largest value of any columns with data.
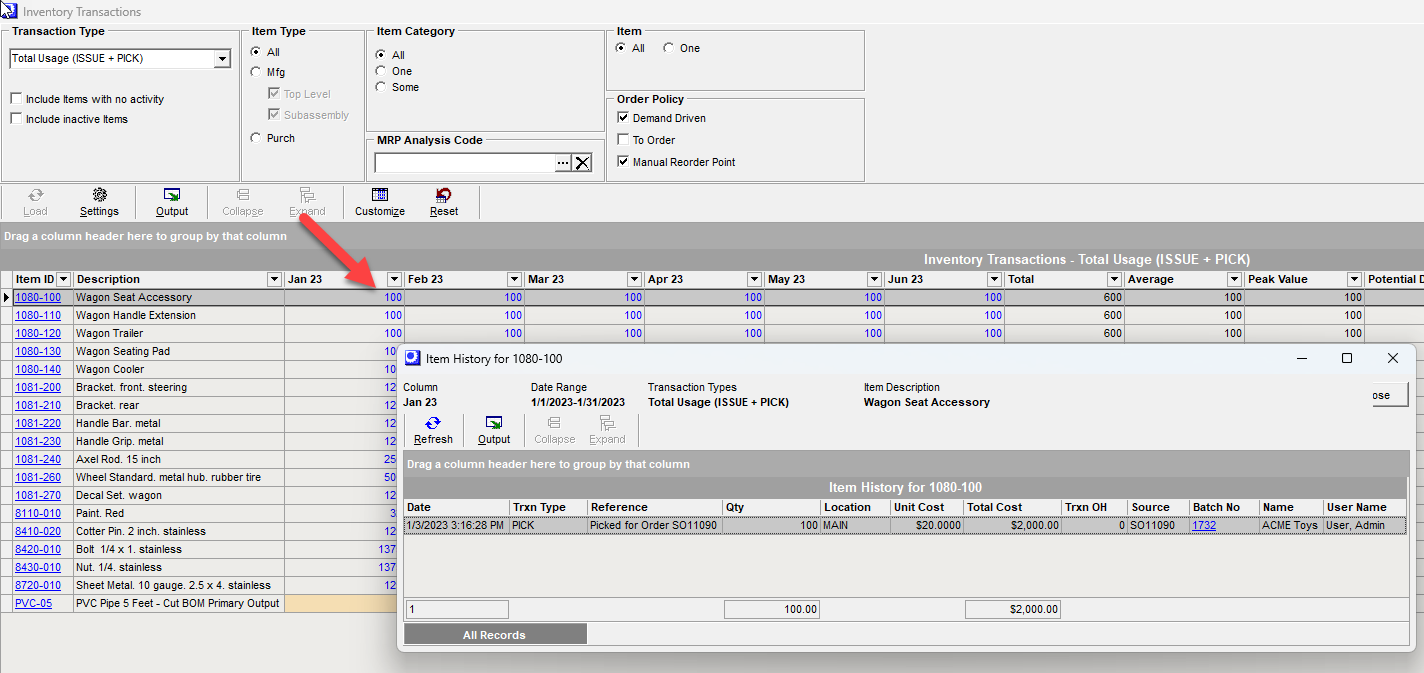
Data drill through
For cell values in light blue, you can drill through to the Item History screen for the Transaction Type of your report.
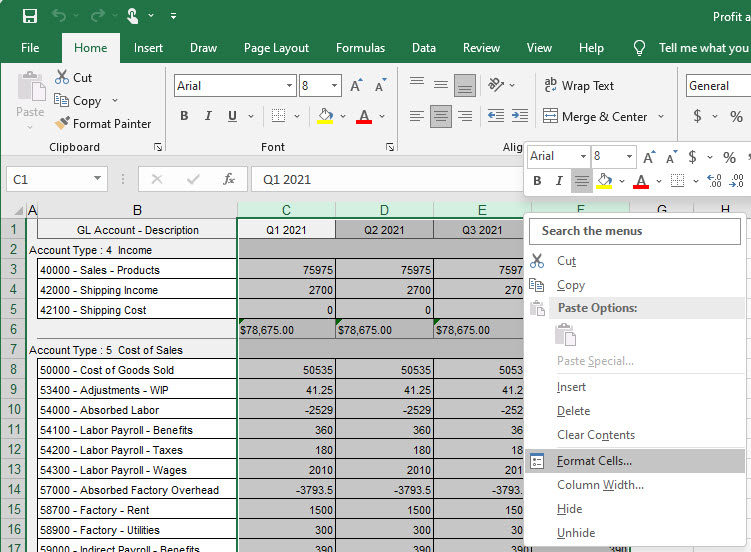
Output Screen (Output Button)
Click the Output button to output the grid contents using a variety of filtering and sorting options. You can print this report or output to Excel.
Link:
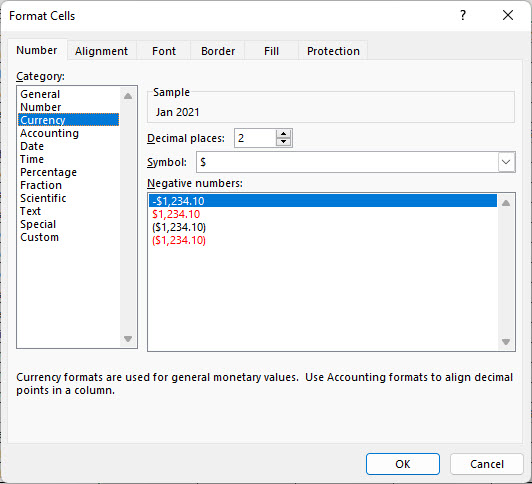
Excel Formatting Tip: Currency formatting does not pass through to Excel. After you export a report to Excel, highlight all of the Excel Column Headers that are currency values and right click, select Format Cells, on Number tab select Category = Currency and choose preferred formatting.