The Analysis screen utility is a reporting tool found throughout DBA that enables you to create multi-period reporting on data with active drill through to source transactions.
Analysis Screens

Related Videos:
 Analysis Sales by Item - Series of Columns
Analysis Sales by Item - Compare Two Columns
Analysis Monthly Trend for Stock Items
Analysis Balance Accounts Overview
Overview
▪Define custom time periods and special calculations in the Settings screen
▪Load data to grid
▪Sort, Group, and Customize data in grid
▪Optionally Output to Excel
Buttons
Load
After you have defined your reporting columns in the Settings screen, click this button to populate the reporting grid.
Settings
The settings button is where you define and edit the dynamic columns for your analysis (see details below).
Output
Click this button to output the grid contents using a variety of filtering and sorting options. You can print this report or output to Excel
Link:
Collapse, Expand
The grid supports a drag and drop grouping of data.
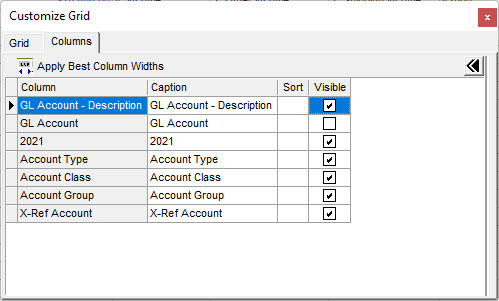
Customize, Reset
You can customize the fields that display in the grid. Reset will restore the default grid settings.
Settings Screen (Settings Button)
This Settings button will be used to add and edit the columns for your analysis. You must first define your columns and then use the Load button to populate the report grid.
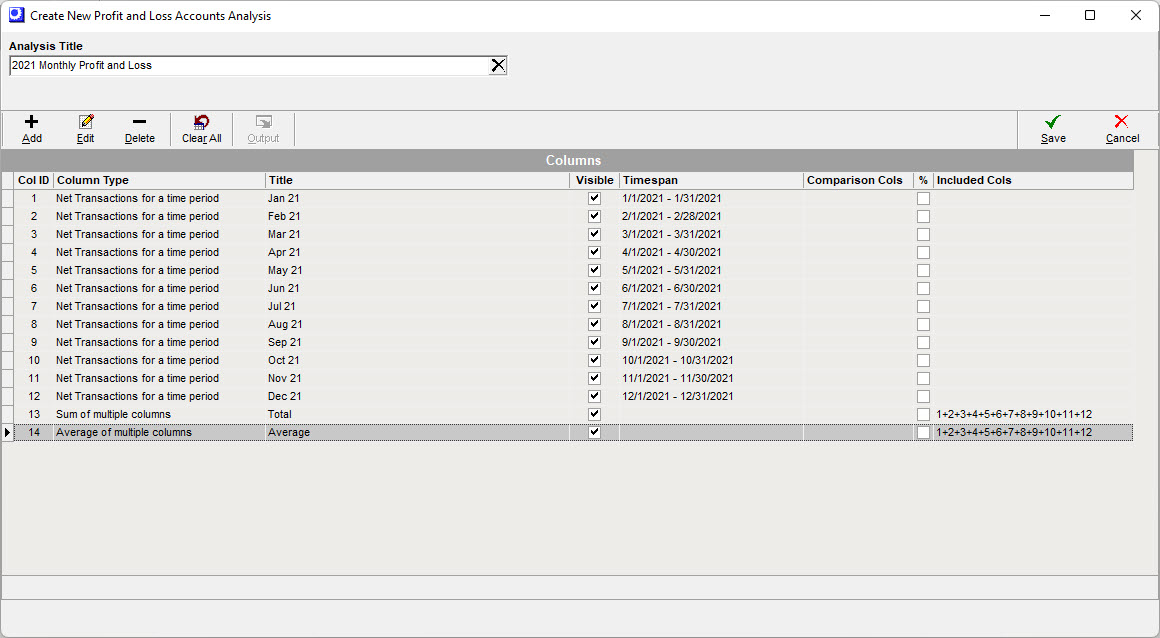
Analysis Title
This is the name of the report and output to Excel.
Settings Screen Buttons
Add Button
The Add button is used to define the columns for analysis. (See details below)
Edit Button
Select any column in the grid to edit.
Delete Button
Select any column in the grid for deletion. If the column is used in a calculation you may be prevented from deletion. You can use the clear all and start over.
Clear All
This will clear all columns in the Settings grid for a quick start over.
Add Button
You must add a time period column(s) or a time period series of columns prior to loading data for analysis.
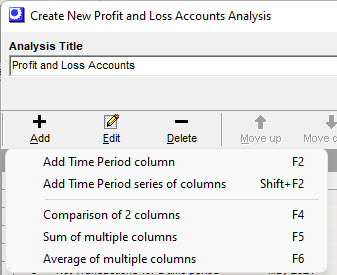
Add Time Period column
This will allow you define a period of time for your report analysis. As an example, you may want to create a period for the most recent Accounting Period and then make a second column for year to date values.
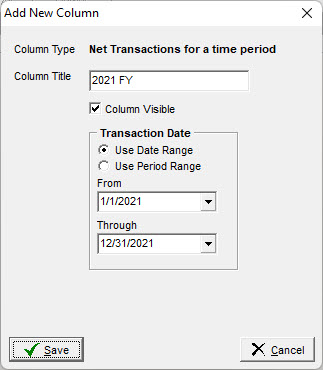
Column Type
This will describe the criteria for the data summary for the defined report column.
Column Title
This will be the heading of the column of your report. You can edit this at any time and then Load the report to update in the report analysis grid.
Column Visible
If this is checked, the column will be visible in the report grid.
Transaction Date
Select either a date range or accounting period range.
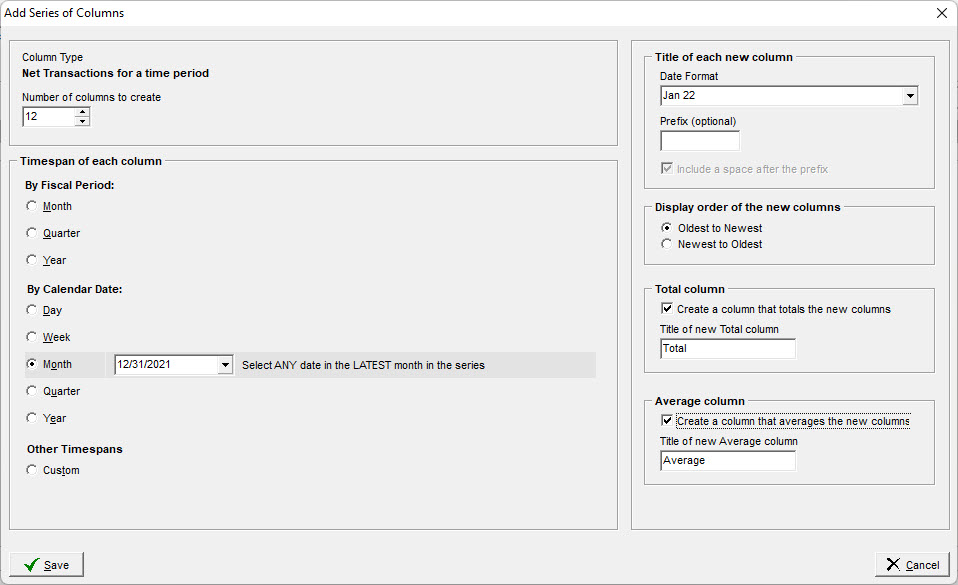
Add Time Period series of columns
This will allow you define a sequential series of columns for your report analysis. As an example, at year end you can perform a monthly report for the trailing 12 months. You will enter the last date of the series and then define the number of columns trailing to create.
Column Type
This will describe the criteria for the data summary for the defined report column.
Number of columns to create
This will set the number of sequential date columns to create. You will select the grouping and last date in a timespan and it will create the trailing time period columns.
Timespan of each column
You define the timespan of each column and select the final date in the range.
By Fiscal Period
Report column groupings by period, quarter or year. Choose the last accounting period in the range. Verify the number of columns to create.
By Calendar Date
Report column groupings by day, week, month, quarter or year. Choose the last date in the range. Verify the number of columns to create.
Other Timespans
Define a custom range of time. Choose the last date in the range. Verify the number of columns to create
Report Examples:
For a quarterly report for 2021, you choose the Quarter radio button, choose the last period of Q4 for 2021 or the last date of Q4 of 2021, and set the number of columns to create = 4.
For a monthly report for 2021, choose the Month radio button, choose the final period or last day of 2021, and set the number of columns to create = 12.
Title of each new column
Choose the format of the columns created. Optionally you can add a prefix to your columns.
Display order of the new columns
This allows you to designate your preference of date order of your report columns from left to right.
Total Column
If selected, a column will be created that will be the total of all columns created with this tool. You can customize the column header title.
Average Column
If selected, a column will be created that will be the average of all columns created with this tool. You can customize the column header title.
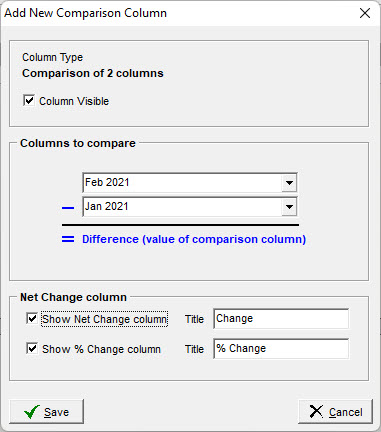
Comparison of 2 columns
After you have added two or more columns to the Settings grid you can compare any two columns of data. You can calculate and display a total net change and/or a percentage change.
Column Type
This will describe the criteria for the data summary for the defined report column.
Column Visible
If this is checked, the column will be visible in the report grid.
Columns to compare
Select the two columns for comparison. Note that the second column selected is subtracted from the first column.
Net Change column
You can select to show Net Change and/or % Change columns. You can customize the column title for each.
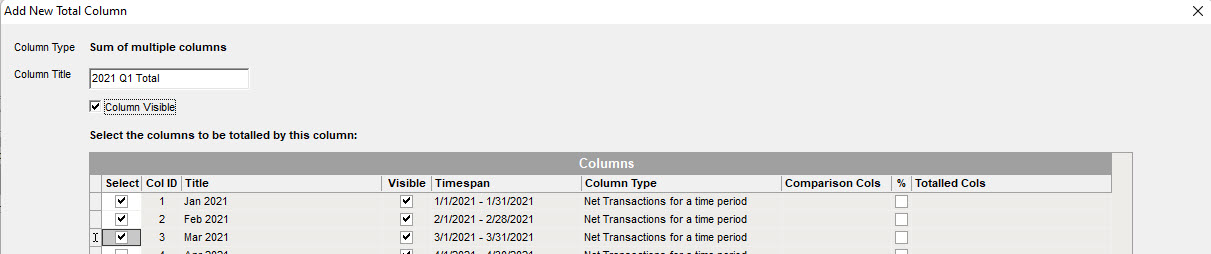
Sum of multiple columns
After you have defined multiple columns you can sum any two or more. Note: The series of columns has a built in total option.
Column Type
This will describe the criteria for the data summary for the defined report column.
Column Title
This will be the heading of the column of your report. You can edit this at any time and then Load the report to update in the report grid.
Column Visible
If this is checked, the column will be visible in the report grid.
Select Checkbox
Select all columns you wish to be included in the total calculation.
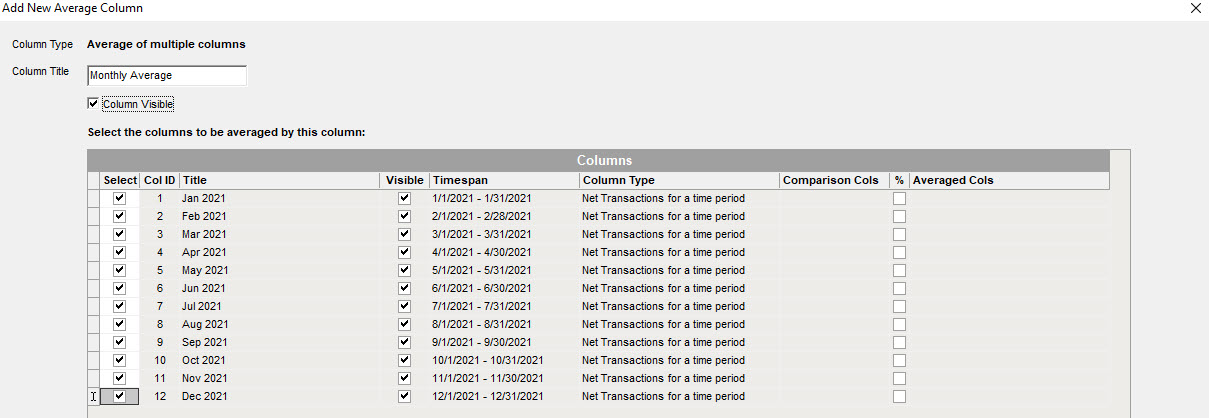
Average of multiple columns
After you have defined multiple columns you can average any two or more columns. Note: The series of columns has a built in average option.
Column Type
This will describe the criteria for the data summary for the defined report column.
Column Title
This will be the heading of the column of your report. You can edit this at any time and then Load the report to update in the report grid.
Column Visible
If this is checked, the column will be visible in the report grid.
Select Checkbox
Select all columns you wish to be included in the average calculation.
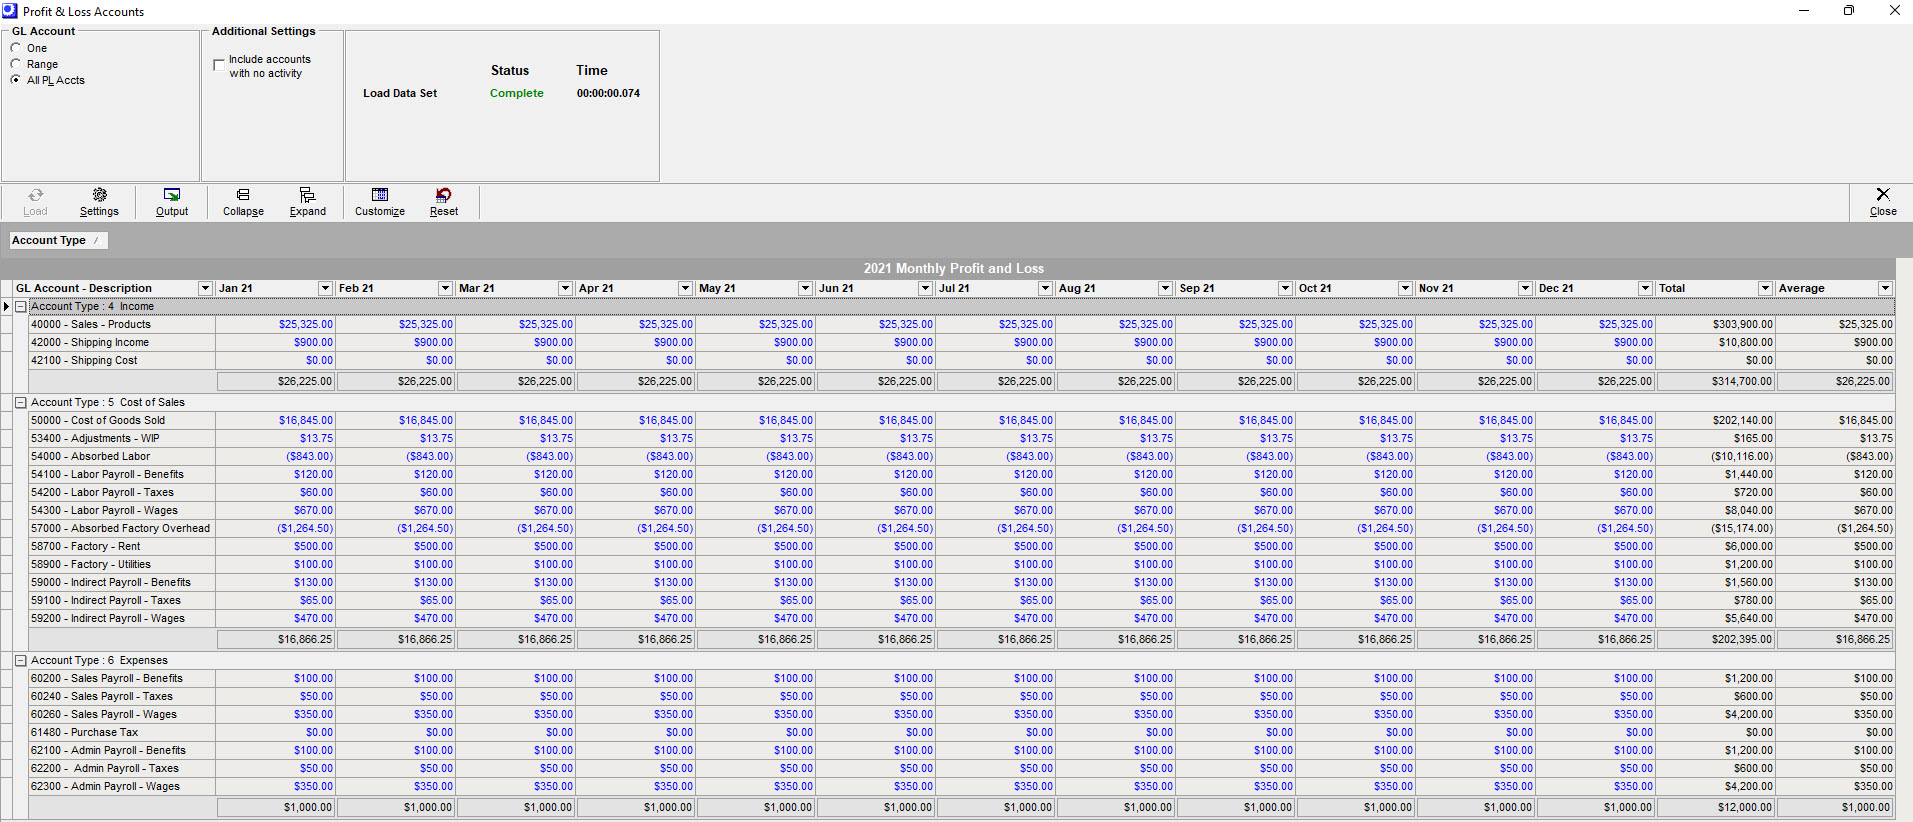
Analysis Grid Fields
Grouping
You can create groupings of data by dragging a column heading into the header panel of the screen.
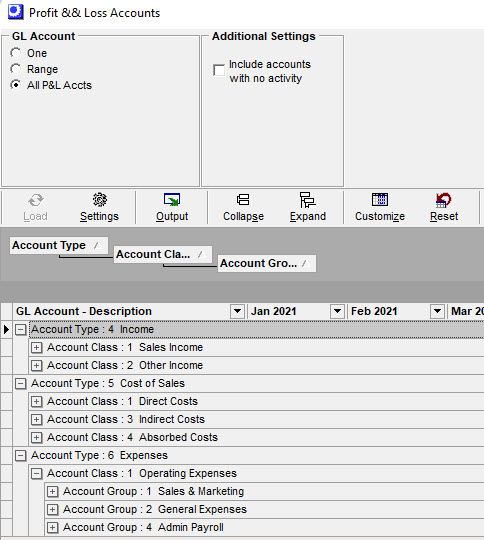
User defined data columns
The data columns are defined in the settings screen. If you would like to modify a column header, you can go to the Settings button and edit the title.
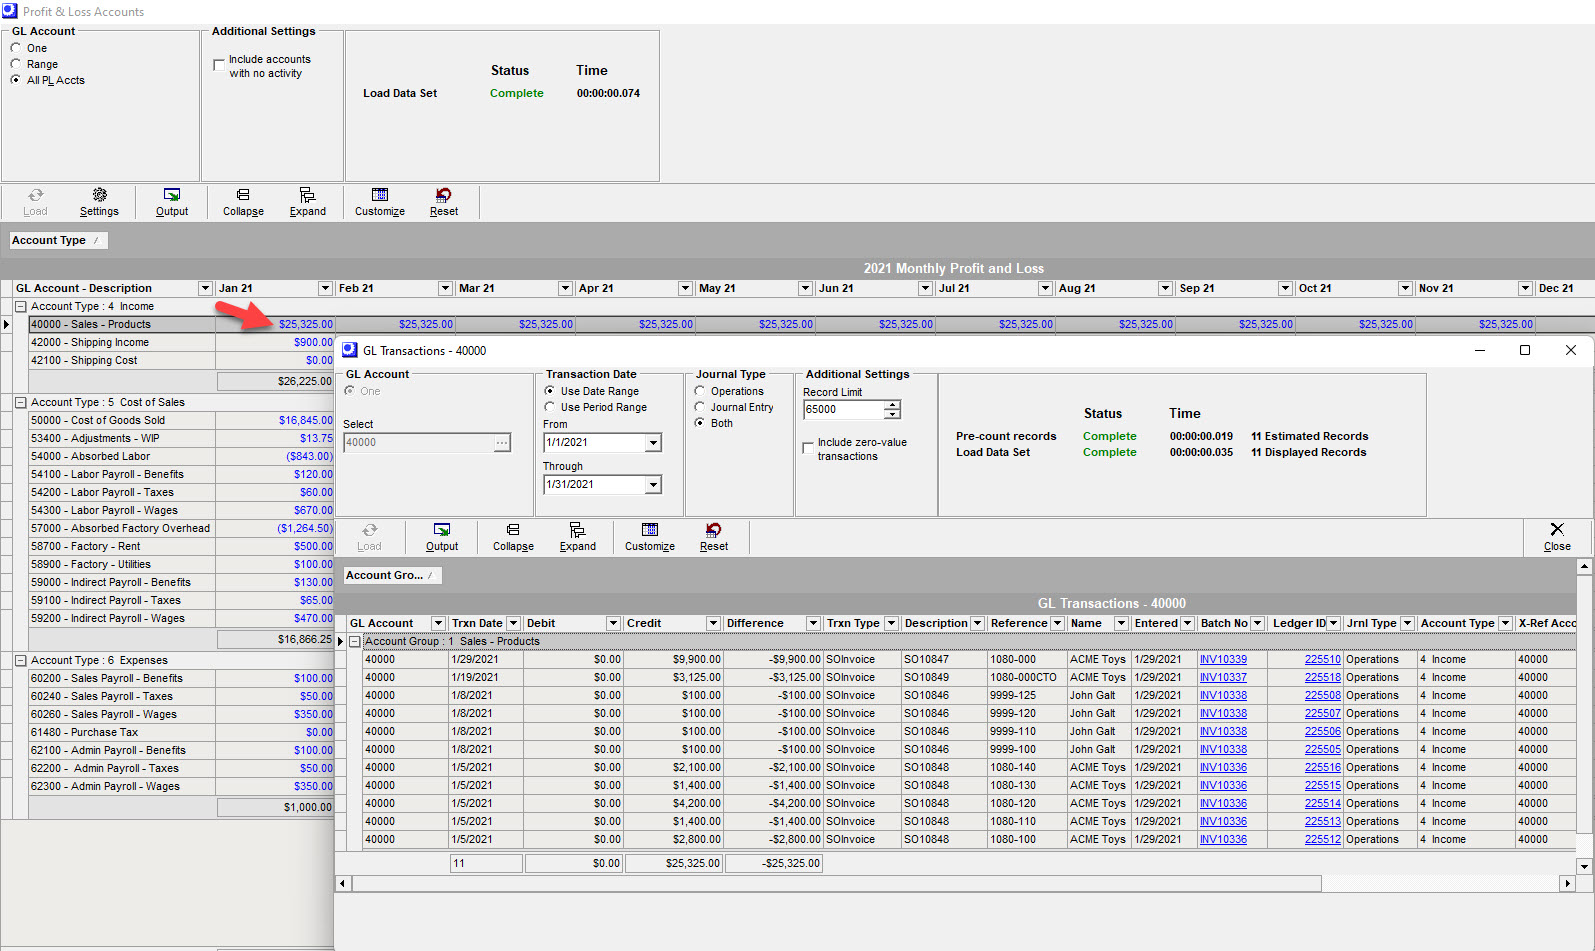
Data drill through
For cell values in light blue, you can drill through to the GL Transactions Detail screen.
Output Screen (Output Button)
Click the Output button to output the grid contents using a variety of filtering and sorting options. You can print this report or output to Excel.
Link:
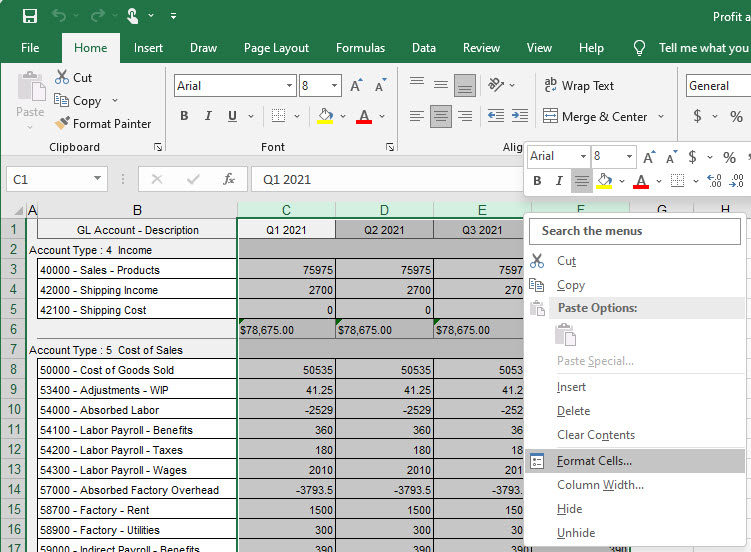
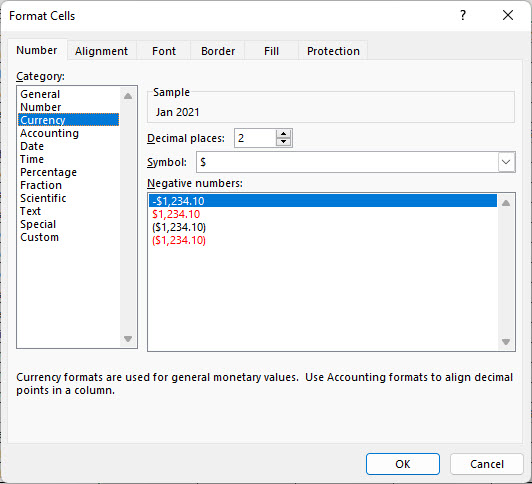
Excel Formatting Tip: Currency formatting does not pass through to Excel. After you export a report to Excel, highlight all of the Excel Column Headers that are currency values and right click, select Format Cells, on Number tab select Category = Currency and choose preferred formatting.