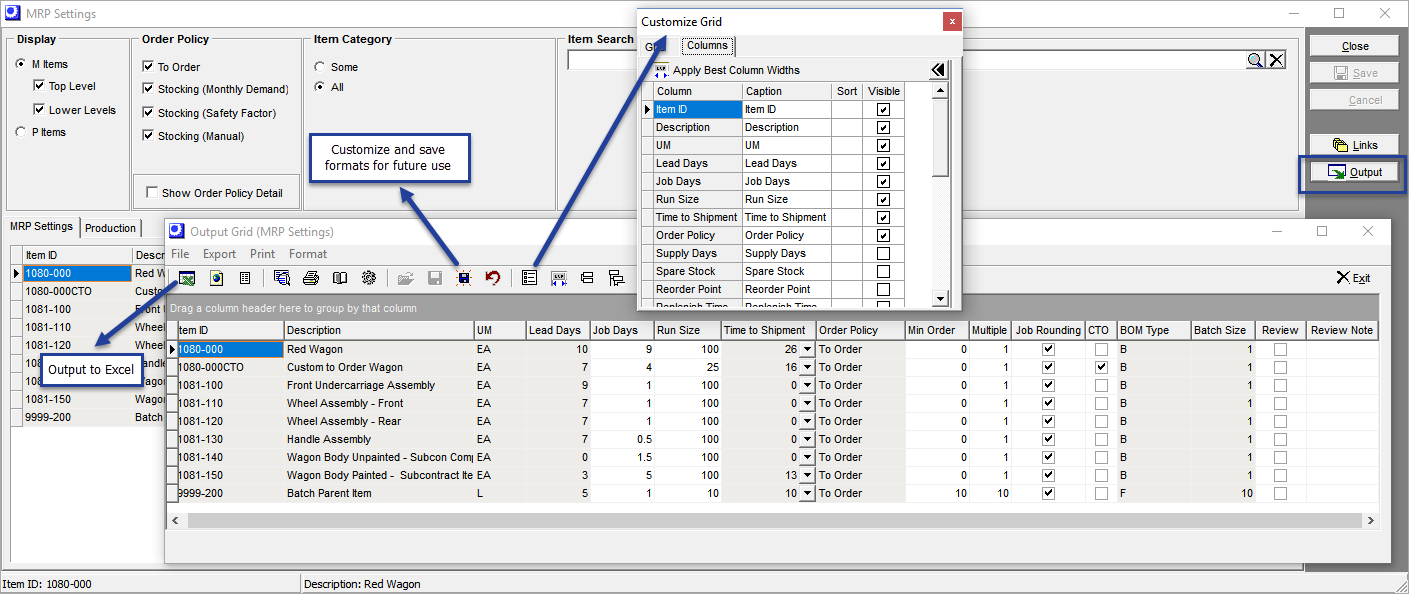
Most grids throughout the system include an Output button/icon, which launches the Output Grid tool. The Output Grid tool is used to is used to customize the grid display and to generate export files.

Screen Details
Upper Panel
File
Use this menu to exit the screen.
Export
This menu provides various export options. See the tool bar options below for feature explanations.
This menu provides various printing options. See the tool bar options below for feature explanations.
Format
This menu provides various grid formatting options. See the tool bar options below for feature explanations.
Tool Bar
Export to Excel, HTML, CSV
These first three icons are used to export the currently displayed grid contents. You can generate an export file in Excel, HTML, or CSV format.
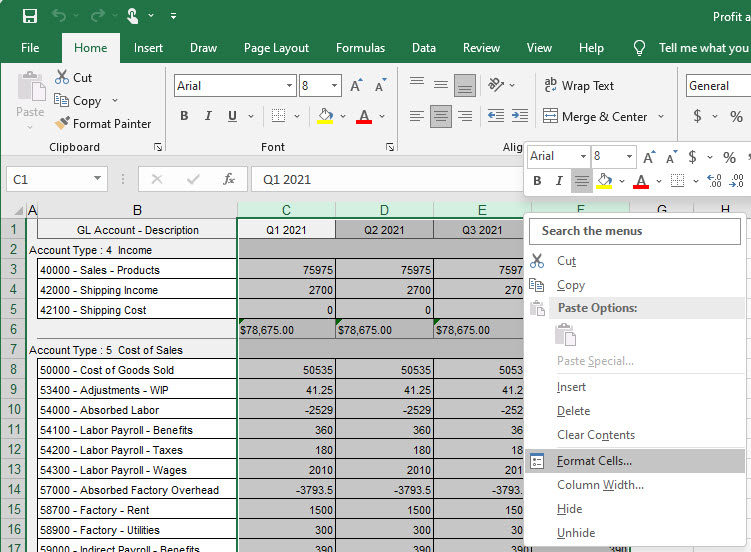
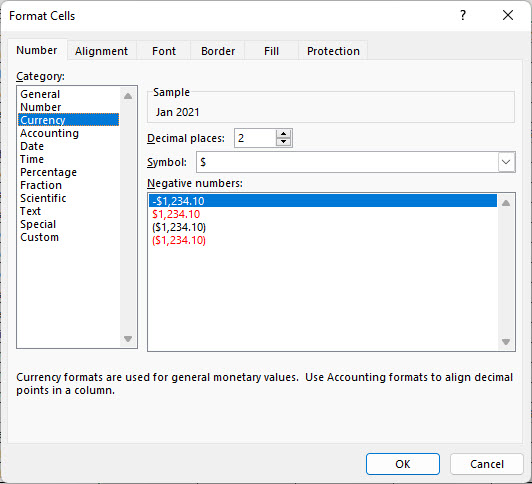
Excel Formatting Tip: Currency formatting does not pass through to Excel. After you export a report to Excel, highlight all of the Excel Column Headers that are currency values and right click, select Format Cells, on Number tab select Category = Currency and choose preferred formatting.


Print Preview, Print, Page Setup, Report Designer
These options enable you to preview and print the grid contents in a report format.
NOTE: The Report Designer formatting cannot be saved and is only usable for the current session.
Load Saved Grid Format
Use this option to select a saved grid format and load its layout into the grid.
Save Current Grid Format
Use this option to save the current grid layout to the current grid format.
Save Current Grid Format as
Use this option to save the current grid layout to a format name for later retrieval.
Reset Grid Formatting
Use this option to reset the grid to the default layout.
Customize Grid Display
Use this option to customize the grid contents. Enter sequential numbers in the Sort column to control the column sort order. Clear the Visible check mark to hide a column.
Apply Best Column Widths
Click this icon to automatically size the column widths to fit the displayed data.
Collapse All Groups, Expand All Groups
If the grid has been grouped by dragging a column into the upper panel, click these icons to collapse (hide) the group lines or to expand (display) the group lines.
Upper Panel
Creating Sub-Groups
You can drag and drop any column heading into the upper panel to group associated lines by that column value.
